Highlevel CRM: What are top five BEST dashboard/reporting options?
I've been asked many many times (online and in-person) about how to get better and better-looking data out of Highlevel. I've listed my recommended options below.
I've personally used all of these options at some point in our company's two decades in business. 1. Start with the HL dashboard . Between the main dashboard and the options under reporting there is A LOT of data available but this mainly applies when you are running almost all of your business on HL. If that doesn't do it for you or your want some more advance options look at one of the dedicated tools below . 2a. If you run an Agency then look at Agency Analytics. It has HL integration by default and like it says you can built plenty of dashboard AND auto emailed reports for your clients.
AgencyAnalytics is a marketing-reporting and dashboard platform built with agencies (and in-house teams) in mind. Its purpose is to bring together disparate data sources (SEO, PPC, social, web analytics, call tracking, etc.), automate reporting, and provide easily digestible dashboards both for internal use and client-facing deliverables. 
Rather than manually assembling spreadsheets and slide decks for each client campaign, you can centralize your metrics, white-label reports, and scale your reporting infrastructure.
Key Features
1. Broad Integrations & Data Sources
AgencyAnalytics supports 80+ native integrations (Google Analytics, Google Ads, Facebook/Meta Ads, Bing Ads, call tracking platforms, rank trackers, etc.) to bring in data across channels. 
This means you can pull in SEO metrics (rankings, organic traffic), PPC campaign data, social metrics, website analytics — all into one dashboard. For an agency juggling multiple clients, this kind of consolidation is highly valuable.
2. Customizable Dashboards & White-Label Reports
You can create dashboards for each client with drag-and-drop widgets, use ready-made templates, and apply white-label branding so your reports appear as your own deliverable. 
Also you can schedule reports to be sent automatically, deliver client portals or shareable links, allowing clients to access their metrics independently. This elevates your offering and reduces manual labour.
3. Automated Reporting & Scheduling
Instead of manually compiling metrics weekly/monthly, AgencyAnalytics allows you to automate report creation, scheduling, and distribution. This saves hours of time and reduces error. Users frequently cite time-savings as a major benefit. 
You can “set and forget” client reporting, freeing you up for strategic work rather than repetitive tasks.
4. Monitoring, Metrics & Alerts
You can set up KPI tracking, goal monitoring and alerts when metrics deviate from expected ranges. This capability helps agencies proactively flag issues (e.g., a drop in traffic or ad performance) and respond faster.
5. Client Access & Multi-Client Management
Because agencies often handle many clients, the platform supports management of multiple accounts, dashboards per client, client log-ins, role-based access, etc. Reviews highlight the ease of onboarding and sharing with clients. 
This means as your client base grows, you don’t have to scale your reporting processes linearly.
Benefits for Your Business
• Efficiency & Time Savings: By automating data pulls and reports, you save substantial manual effort. Many users say it reduced hours spent on report preparation each week. 
• Clarity & Transparency: With all channels in one dashboard, it’s easier to view performance holistically (SEO + PPC + social) rather than in silos. This gives both you and your clients clearer insight into what’s working.
• Client Perception & Credibility: White-label, clean dashboards and on-demand access elevate your professional image. Clients appreciate easily digestible visuals and timely updates.
• Scalability: As your client roster grows or you manage more campaigns, you don’t need to increase your reporting team proportionally—AgencyAnalytics handles much of the load.
• Performance Monitoring & ROI Focus: When you can monitor across platforms and set KPIs/alerts, you’re better positioned to optimize campaigns proactively, address under-performance faster, and demonstrate ROI to clients.
• Differentiation: Many agencies still rely on manual reporting or fragmented tools. Using a unified dashboard/automated solution gives you a service advantage and positions you more professionally.
Things to Consider / Limitations
While AgencyAnalytics is strong, reviews do note some caveats:
• Some integrations or metrics may be missing or require workarounds. 
• Dashboard layout and deep customization (especially advanced data blending or custom dimensions) can be more limited compared with more enterprise-grade BI tools. 
• For very large enterprises or very custom data workflows, you might eventually outgrow the platform or require complementary tools.
If your business is a marketing agency or you’re managing multiple channels/campaigns for clients, AgencyAnalytics gives you a streamlined way to centralize data, automate reporting, and deliver professional dashboards. You’ll gain time back, improve transparency with clients, scale more easily, and focus more on strategy than on spreadsheets. While it may not replace ultra-custom BI platforms for complex enterprises, it offers a very strong solution for agencies seeking efficiency, clarity and growth.
2b. If you need detailed ad reporting and custom journey reporting look at Segmetrics. They have a HL integration and one of their strategists Scott Queen is pretty involved in the HL world. I've seen him at the last two Highlevel CRM conferences.
SegMetrics is a marketing analytics and attribution platform built to help businesses connect all their tools (ad networks, CRMs, payment processors, email systems, etc.) and uncover not just what is happening in their marketing funnel, but why it’s happening, and how much revenue it drives. 
In short: instead of merely measuring clicks, impressions or leads, SegMetrics ties those events to real customer journeys and lifetime value (LTV) so you know which sources, campaigns, offers and segments are truly profitable. 
Key Features
1. Cross-platform integrations & tracking
SegMetrics supports integrations with 100+ marketing tools, ad platforms, CRMs and payment systems.  It can track leads from any traffic source through to purchase, applying visitor identification, fingerprinting, self-hosted pixels and server-side tracking to mitigate ad-blockers or multi-device issues. 
2. Visitor journey & funnel analytics
You can follow a prospect from their first touch (ad click, page view) through email sequences, downloads, sales calls or purchases. SegMetrics surfaces where leads drop off, which touchpoints lead to the highest conversion and which sources deliver highest value. 
Its “middle-of-funnel engagement analytics” brigs clarity to the gap between lead capture and purchase. 
3. Advanced segmentation & cohort analysis
SegMetrics lets you slice and dice your audience by any action or attribute (clicked link, viewed video, attended webinar, tag in CRM) and measure how those segments perform in revenue and conversion rates. 
This allows you to find your best-performing leads (and worst) and focus budget accordingly. 
4. Lifetime value (LTV) tracking & attribution
Rather than just tracking first purchase, SegMetrics evaluates how much revenue a lead has generated over time — crucial for subscription, membership, coaching or recurring payment businesses. 
In addition, it attributes revenue back to traffic sources, ad spend, and campaigns so you can calculate true return on ad spend (ROAS) and lifetime ROI. 
5. Real-time reporting, dashboards & customisation
SegMetrics offers live reports (not delayed), with custom dashboards, pre-built templates (for e-commerce, SaaS, infoproducts) and the ability to build your own KPI views. 
You can also have weekly reports sent to you, save templates and pull up the exact contacts or transactions that underpin any metric (for transparency). 
6. Advertising and offline conversion optimisation
SegMetrics helps feed real conversion data (including offline, phone, in-person) back to ad networks like Facebook and Google so those platforms’ algorithms can optimise for actual revenue rather than just clicks. 
It includes a Chrome extension to show true ROAS in your ad dashboards. 
7. Guidance, onboarding & AI insights
For those needing help, SegMetrics offers support, training calls, and strategic services. They also provide an “AI Insights” feature which uses GPT-powered analysis to generate actionable insights from your data. 
⸻
Benefits for Your Business
• Clarity on what actually drives revenue: Instead of relying on surface metrics (leads, clicks), you see which sources and segments contribute to bottom-line revenue and LTV.
• Smarter budget allocation: You can stop wasting spend on inefficient campaigns and invest more in what works.
• Improved decision-making: With real-time data and segment breakdowns, you can pivot quickly, optimise funnels, refine offers and messaging.
• Better customer insights: Understand who your best customers are (by source, behavior, attributes) and replicate those patterns.
• Holistic funnel view: From ad click → lead → nurture → purchase → upsell/renewal, you have visibility across the entire customer lifecycle.
• Higher ROI from ads and offers: By attributing true conversions (including returns/refunds) and feeding accurate data back to ad platforms, you can improve targeting, scale wisely and increase profitability.
• Scalability and sophistication: Whether you’re a small business or enterprise, SegMetrics supports advanced segmentation, server-side tracking, multi-currency, APIs and dedicated support in higher tiers.
If your business runs multiple marketing channels, uses email/CRM funnels, spends on ads, and cares about recurring value or high-ticket offers, SegMetrics gives you the “missing link” of true data clarity. Rather than guessing which campaigns or ad spend drive value, you can measure it directly — know which leads turn into long-term buyers, which offers perform best, and which traffic sources to scale or kill. For teams serious about growth, accountability and maximizing ROI, SegMetrics is a strong choice.
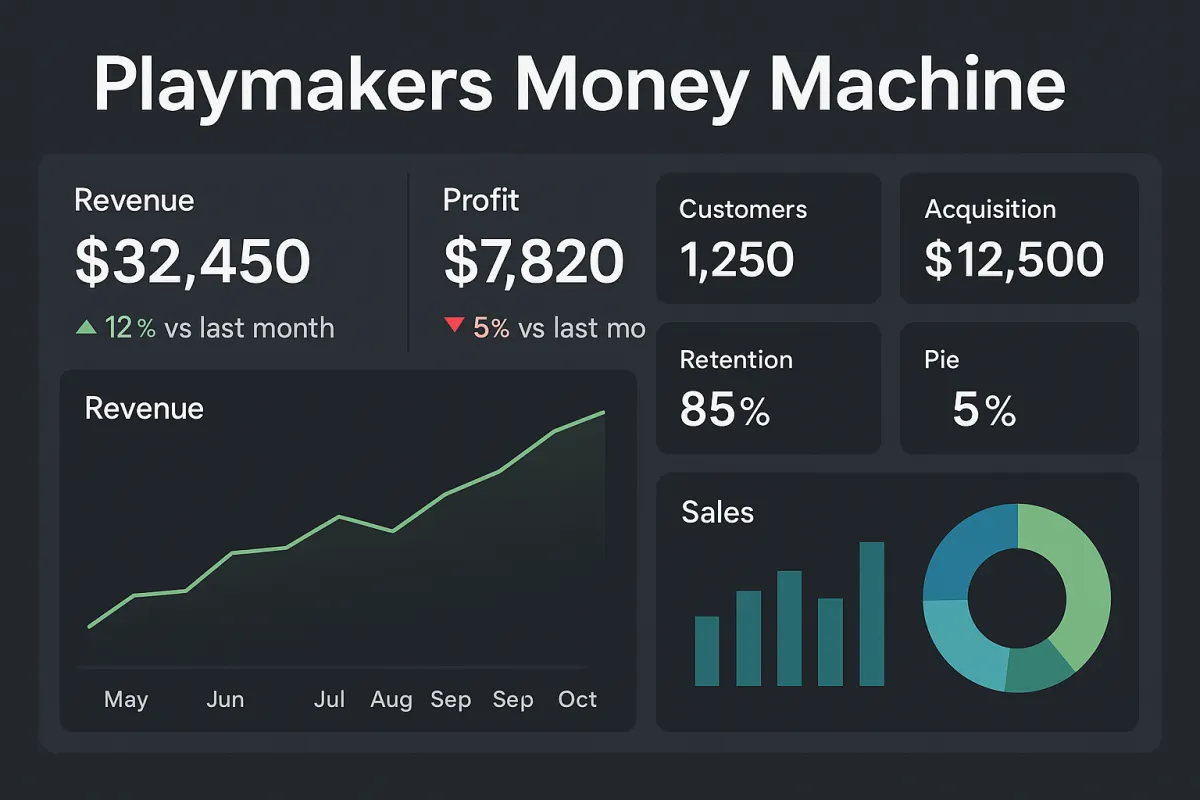
2c. If you love beauty and want a mobile app for a quick KPI / Dashboard check in then look at Databox. They just added a HL integrations. IMO this is one that generates the most colorful and beautiful reports. There is an ipad/iphone app and even a beautiful dashboard you can put on a large screen at a conference or in a conference room that autorefreshes.
Databox is an all-in-one business analytics and performance dashboard platform designed to help teams visualize, track, and improve their key performance indicators (KPIs) in real time. It connects your marketing, sales, financial, and operational data into one unified view—making it easier to understand what’s working, what’s not, and where to focus next. For growing businesses, Databox acts like a mission control center for decision-making, turning complex data into clear, actionable intelligence.
1. Centralized Performance Tracking
Databox eliminates the need to log into multiple platforms to view your metrics. It integrates with hundreds of popular tools such as Google Analytics, HubSpot, Salesforce, Facebook Ads, Google Ads, Shopify, and more. This centralization allows you to monitor data from marketing campaigns, sales pipelines, and customer engagement all in one place. The result is a simplified, time-saving workflow where teams spend less time pulling reports and more time acting on the insights.
2. Customizable Dashboards
The platform’s drag-and-drop dashboard builder allows you to create highly customized, visually appealing dashboards that fit your exact business goals. You can design dashboards by department, client, or campaign—each with real-time visualizations like charts, graphs, and goal progress bars. This flexibility empowers leaders to track metrics that truly matter, whether it’s lead generation, revenue growth, or customer retention.
3. Goal Setting and Performance Alerts
Databox goes beyond passive reporting by letting you set specific goals and receive automated performance alerts. You can establish measurable targets for your KPIs and get notified instantly when performance trends upward, downward, or crosses key thresholds. These proactive alerts encourage data-driven decision-making and allow teams to make quick adjustments before issues become major problems.
4. Mobile Accessibility and Real-Time Insights
With Databox’s mobile app, executives and team members can stay connected to business performance from anywhere. Dashboards update in real time, offering instant access to data insights without waiting for end-of-week or end-of-month reports. This real-time visibility keeps teams agile, improving response time and accountability across the organization.
5. Automated Reporting and Templates
For agencies and businesses managing multiple clients or departments, Databox automates the reporting process. You can schedule recurring reports, use pre-built templates, or clone existing dashboards for quick deployment. These automation features reduce administrative workload while maintaining professional, consistent reporting standards.
6. Integration with Custom Data Sources
Databox supports SQL, API, and Google Sheets integrations, meaning even custom or proprietary data can be pulled into your dashboards. This ensures no data is left behind and allows businesses to create a complete, holistic picture of performance across platforms.
⸻
Key Benefits
• Time Efficiency: Replace manual spreadsheets and report-building with automated dashboards.
• Clarity: See your most important metrics at a glance and identify trends instantly.
• Accountability: Keep teams aligned with transparent performance goals.
• Actionable Insights: Make data-driven decisions faster and more confidently.
• Scalability: Perfect for both small businesses and large agencies managing multiple clients or campaigns.
In short, Databox transforms scattered data into a clear, actionable command center. Whether you’re a solo entrepreneur, marketing agency, or enterprise team, it empowers you to measure what matters, move faster, and make smarter decisions every day.
----
All three of these can send scheduled reports to your clients in addition to creating dashboards. I believe all of them also allow embedding so you can create the dashboard and then create a new menu option on the left to insert the dashboard embed code.
2d. Google Data Studio. Plenty of people love this because it's free. I'm not a fan because it requires some serious geek skills to get up and running. I'm a pretty smart guy and I get frustrated every time I open Data Studio. If you are a super geek or you have one that works for you then this may be an option.